About this Mapplet
This mapplet will help you to create pie charts on Google Maps from Comma Separated Values (CSV) data. The input CSV data for charting has to be formatted as follows:
| Latitude | Longitude | Field1 | Field2 | Field3 |
| DD.DDD | DDD.DDD | Num | Num | Num |
| DD.DDD | DDD.DDD | Num | Num | Num |
where
- the first row must be a header row of the column titles - each column corresponds to a slice of the pie chart; subsequent rows are data rows.
- two of the columns must be geographical latitude and longitude coordinates in decimal degrees representing the origin of the chart i.e. the pie chart center.
- the columns for charting must contain numerical values e.g. 123.567
- each column must be delimited by a separator character e.g. comma, tab, space, or semi-colon.
An example CSV file:
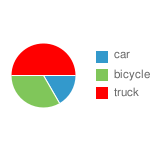
latitude,longitude,car,bicycle,truck
35.1738083,-113.4667968,10,20,30
32.7688004,-98.7890625,30,50,90
43.8345267,-78.0468750,80,190,10
The resultant chart example: